for(i in seq_along(data)) value[[i]] = data[[i]][1]
lapply(data, function(x) x[1])
lapply(data, \(x) x[1])
lapply(data, `[`, 1)
Recent searches
Search options
#RStats
Digital biomedical infrastructure all around the country is built on #AWS . However, simply getting data in/out of AWS, and managing access can be difficult to navigate. This friction motivated us to build sixtyfour, an AWS interface that will feel familiar to #rstats folks. Let us (+ @sean) know what you think!
- Blog post: https://recology.info/2025/04/sixtyfour/
- Repo: https://github.com/getwilds/sixtyfour
- Docs: https://getwilds.org/sixtyfour/
Any  folks know how to install TinyTex into a Debian / Ubuntu image globally? The installer script (https://yihui.org/tinytex/#installation) doesn't work see related (https://github.com/rstudio/tinytex/issues/415)
I'm looking for a good teaching dataset to discuss long and wide format data. Any suggestions?
# contexto: Atropellados en Costa Rica
# objetivo: Distritos-Año mas mortales
# proceso : Ordenar de mayor a menor
#Rstats #CostaRica Costa Rica #softwareLibre
#rstats Is there an existing tool to automate a repex->rpubs pipeline? My current manual workflow is make a reprex in an .R script, copy the contents over to a .qmd, and use the publish feature in the rstudio IDE.
Sometimes my reprexes get just a tad bit more complex and requires some prose to walk through the steps. In those cases I like publishing them as almost like standalone micro blogposts.
Ex: this reprex doc I made to show how to recover ggrepel coordinates https://rpubs.com/yjunechoe/ggrepel-recover-position
R/Medicine 2025 workshop on "Personal R Administration"
Tips, tricks, tweaks, and some hacks for building #datascience dev environments handling new R versions, passwords in your R code, failed package installations and more!
Register now! https://rconsortium.github.io/RMedicine_website/Register.html
#rstats hivemind: would it be too funky to define a package version major.minor.patch.dev as YYYY.MM.DD.VERSION, i.e. map major to year, minor to month, patch to day, and leave the dev component for the actual version..? I'm thinking of a data package whose upstream data releases are versioned based on the date... anyone ever tried such heretic approach? Would CRAN maintainers be okay with this?! ;)
asking for a friend.
# objetivo: Plot de demanda nacional de electricidad del Reino Unido
# proceso : Dos procesamientos:
# - Agrupar por año y contar demanda total
# - Demanda cada 30 minutos entre 2014 y 2016
How big is a file, does it even exist?
gdalraster::vsi_stat(<file descriptor>)
vsi_stat("/vsicurl/https://projects.pawsey.org.au/idea-gebco-tif/GEBCO_2024.tif", "size")
the "file" can be anywhere, invoke any of the GDAL virtual file protocols and comprehensive configuration facilities to stat it
open it, GDAL it, seek,ingest,read,move those bytes this is a super powered package on a rich library
From app to container in one command: export()
{shinydocker} is a new experimental R package handling Docker containerization for both R & Python Shiny apps. It auto-detects dependencies and app type.
Code: https://github.com/coatless-rpkg/shinydocker
Post: https://blog.thecoatlessprofessor.com/programming/r/rethinking-shiny-containerization-the-shinydocker-experiment/
There are 2 new #rstats packages on CRAN:
- 0.00% are in English.
- 0.00% are in other languages than English.
- 0.00% use multiple languages.
- 100.00% do not declare any language.
A curated list of awesome tools to assist development in R programming language. https://indrajeetpatil.github.io/awesome-r-pkgtools/ #rstats #
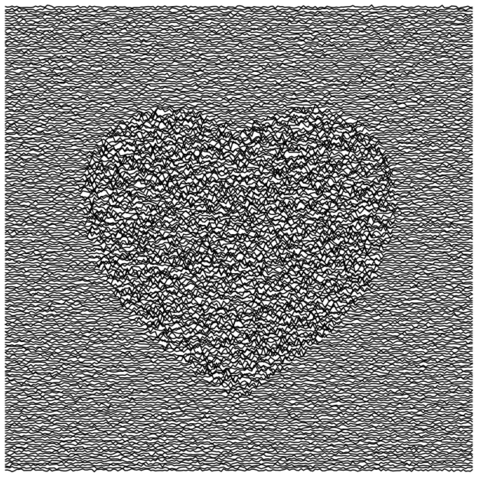
```
library(tidyverse)
crossing(x = seq(-1.7, 1.7, len = 200),
y = seq(-1.5, 2, len = 200)) |>
mutate(heart = (x^2 + y^2 - 1)^3 - x^2 * y^3 <= 0) |>
mutate(noise = .01*rnorm(n(), 0, heart + 0.5)) |>
ggplot() + geom_line(aes(x=x,y=y+noise,group=y)) + theme_void()
```
rsample 1.3.0 is on CRAN! This release contains a more flexible grouping for bootstrap confidence intervals as well as many tidy dev day contributions as general upkeep. #RStats

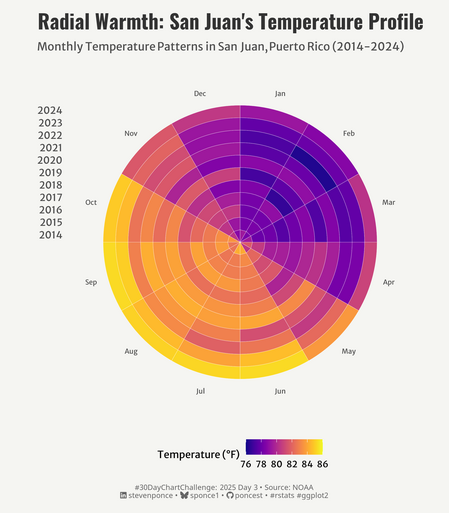
2025 #30DayChartChallenge | day 03 | comparison | circular
.: https://stevenponce.netlify.app/data_visualizations/30DayChartChallenge/2025/30dcc_2025_03.html
.
#rstats | #r4ds | #dataviz | #ggplot2
On #regression models #rstats:
1) cleaning method for test data has more impact than for train data
2) best performance does not require same cleaning process in both test and training data
3) regression models should should test several test cleaning pipelines.
{vrtility} gets its first vignette - how to make HLS composites. I think this example really starts to show how awesome the VRT format can be and how much we can do with it! #rstats #rspatial #gdal
https://permian-global-research.github.io/vrtility/articles/HLS.html
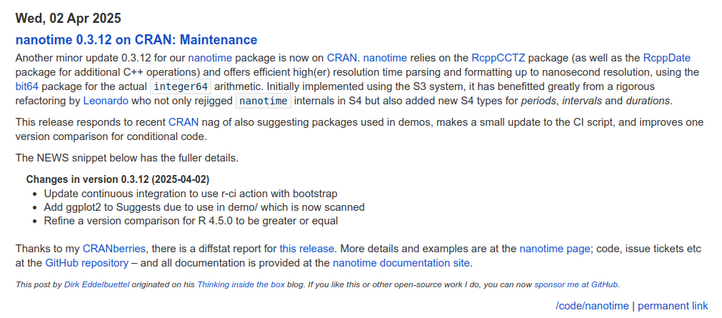
nanotime 0.3.12 on CRAN: Maintenance
High-resolution nanosecond time functionality for R
https://dirk.eddelbuettel.com/blog/2025/04/02#nanotime_0.3.12
#rcpp #rstats


